Inbound spikes in graph
Hello,
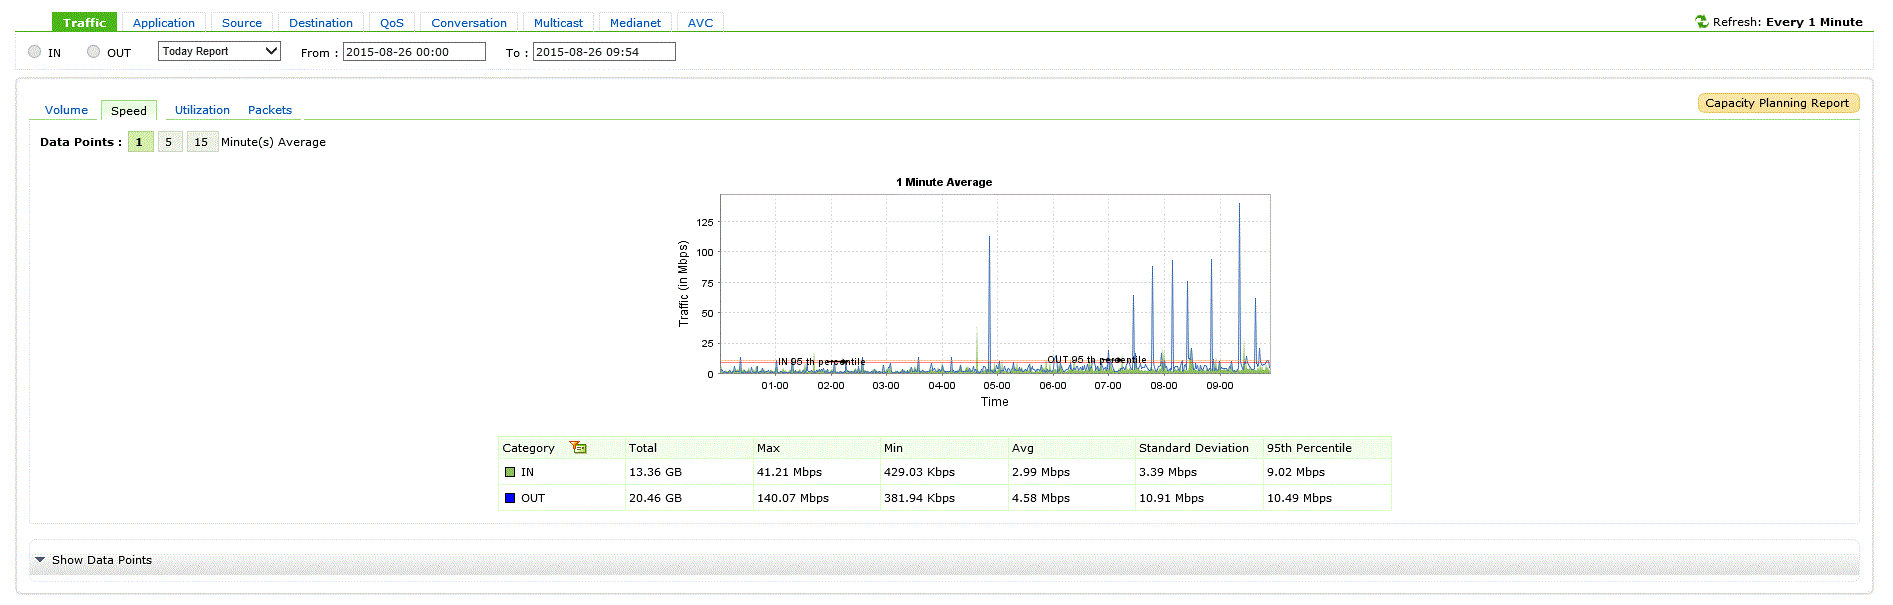


I'm monitoring a gig ethernet interface on Cisco 3925 router. On our 1 minute average traffic graph there are spikes going up to 100 megabits. I'm not sure why these are being reported because I don't believe the carrier is pushing that much traffic towards us. The interface config is below:
p0_wan_r1#sh run int gig0/1
Building configuration...
Current configuration : 157 bytes
!
interface GigabitEthernet0/1
bandwidth 20000
no ip address
duplex full
speed 100
service-policy output SHAPING-PM
end
p0_wan_r1#sh run int gig0/1.3412
Building configuration...
Current configuration : 208 bytes
!
interface GigabitEthernet0/1.3412
bandwidth 20000
encapsulation dot1Q 3412
ip address 192.168.1.41 255.255.255.252
ip pim sparse-mode
ip flow ingress
ip flow egress
end
Is this a normal behavior, has anyone see this before?