Quick tips on SQL server monitoring
In attempts to ensure optimal performance of their SQL servers, DBAs often make the common mistake of overlooking certain key metrics or wrongly prioritize certain metrics over other crucial ones. In this post, we will try to cover the primary metrics that DBAs should keep in mind when it comes to monitoring MS SQL servers. If you are a DBA, you probably already have your own personal list of key metrics to watch out for. Nevertheless, let us take a quick look at how tracking certain key metrics using Applications Manager could help save a lot of time and effort without compromising on SQL server performance.
Page reads/min: This metric offers an understanding about the load on system memory at a given time. When compared to previously recorded data over a period of time, this metric can give you a clear idea about whether or not there is a problem with system memory as it measures the amount of pages read from memory per minute.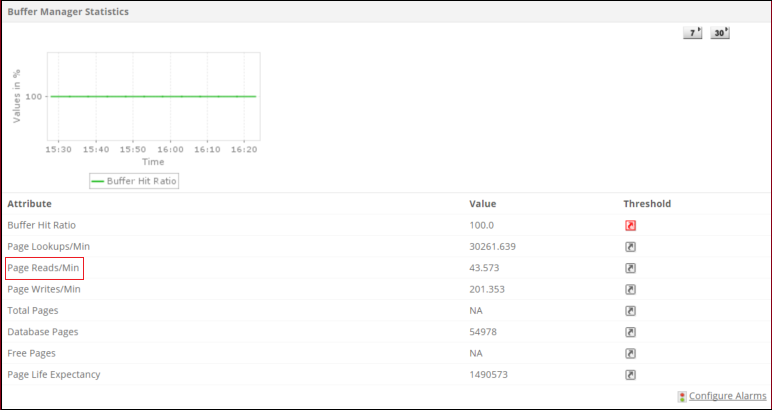
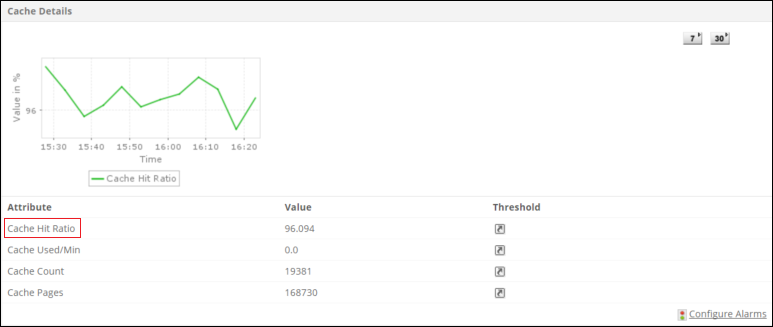
Cache hit ratio: How frequently does your SQL server access pages from cache? That is precisely what this metric shows. Check if the metric displays a higher value (~100) as that would indicate that the pages were accessed from memory and not from the disk. Lower value could be an indication of a bottleneck in the system memory. Additionally, keep an eye out for page life expectancy to understand cache hit ratio better. The longer the page life expectancy, the longer it stays in memory (not disk) and the better the cache hit ratio.
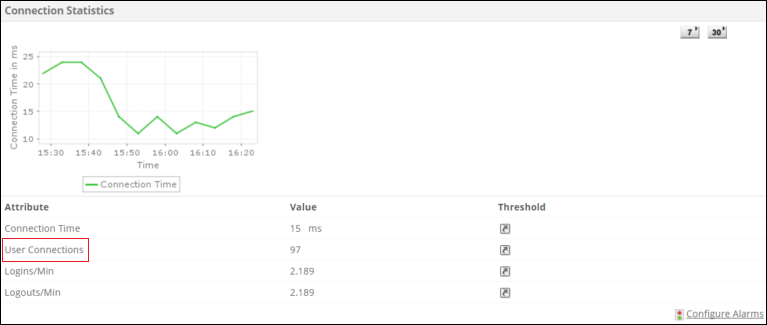
User connections:
This represents the number of users connected to your SQL server. Analysing this data over time can offer insights into the load patterns on system memory and identify related issues quicker.
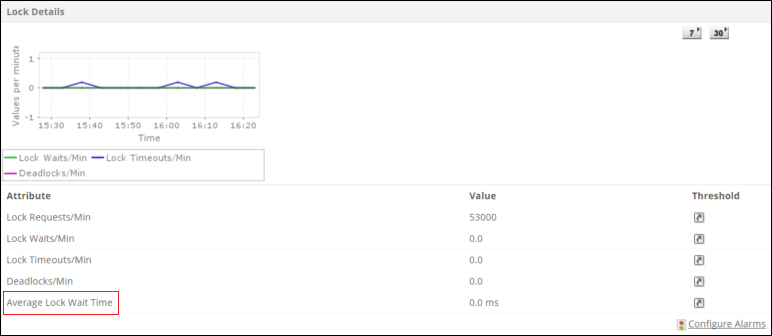
Average lock wait time:
To manage several users on a system, the SQL server 'locks' resources from time to time and therefore processes could be kept waiting. Requests should normally not have to wait on locks and since this is primarily an indication of load, ensure that the value of this metric is zero or close to it at all times.
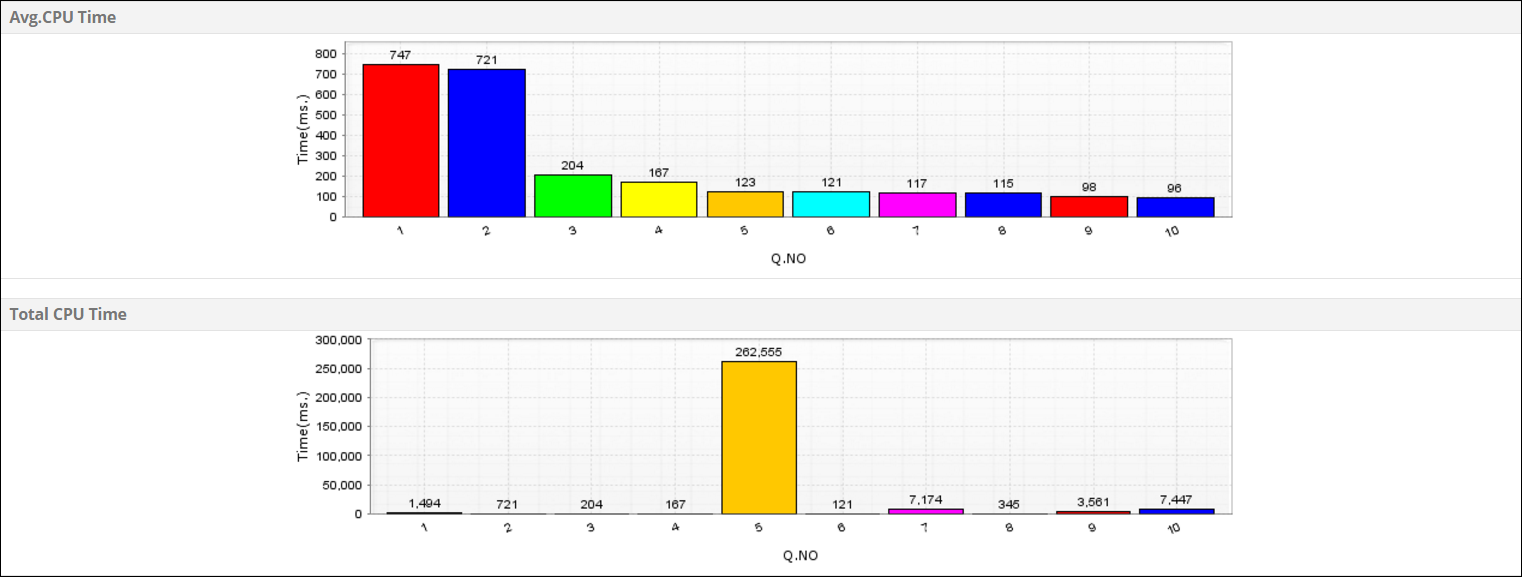
Top Queries by CPU, I/O and top components by memory:
Lastly, don't forget the base resource metrics. Analyzing and correlating these base metrics over time can reveal a lot about performance patterns and often help in understanding the root cause of issues. Also, understanding growing disk space needs from these performance trends can help in proper capacity planning and resource usage.
Stay tuned for more useful SQL server performance tips in our future posts.