Set scale of widgets on OpManager Dashboards?
Our IT department has a few TVs setup that we can all see with OpManager setup so we can monitor devices without having to go to OpManager on our own PCs all the time.
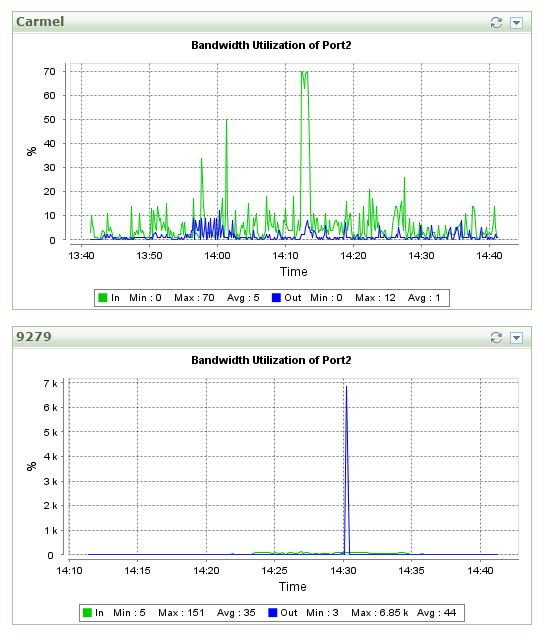
The issue I am having is that the Widget "Real Time Bandwidth Utilization" scales up to the highest percentage of bandwidth used or down to the lowest. There may be several times a day or hour that a device reports the information wrong with 46k % utilization. Causing the graph to show one quick spike, and the rest of the time is just riding the bottom of the graph.
Is there any way to keep the scale of the graph at 100% so a device always has the same scale?
I have tried to get people to accept the "Last Polled Bandwidth Utilization Value" widget, but they want the data that "Real Time Bandwidth Utilization" shows us.
Thank You
P.S.
Here is an image of the issue.