Tips and Tricks : Pivot charts vs Funnel charts
As compared to pie and bar charts, pivot and funnel charts are not used very often. However, they do an excellent job in drilling down to specifics in your data. So, when is it ideal to use them?
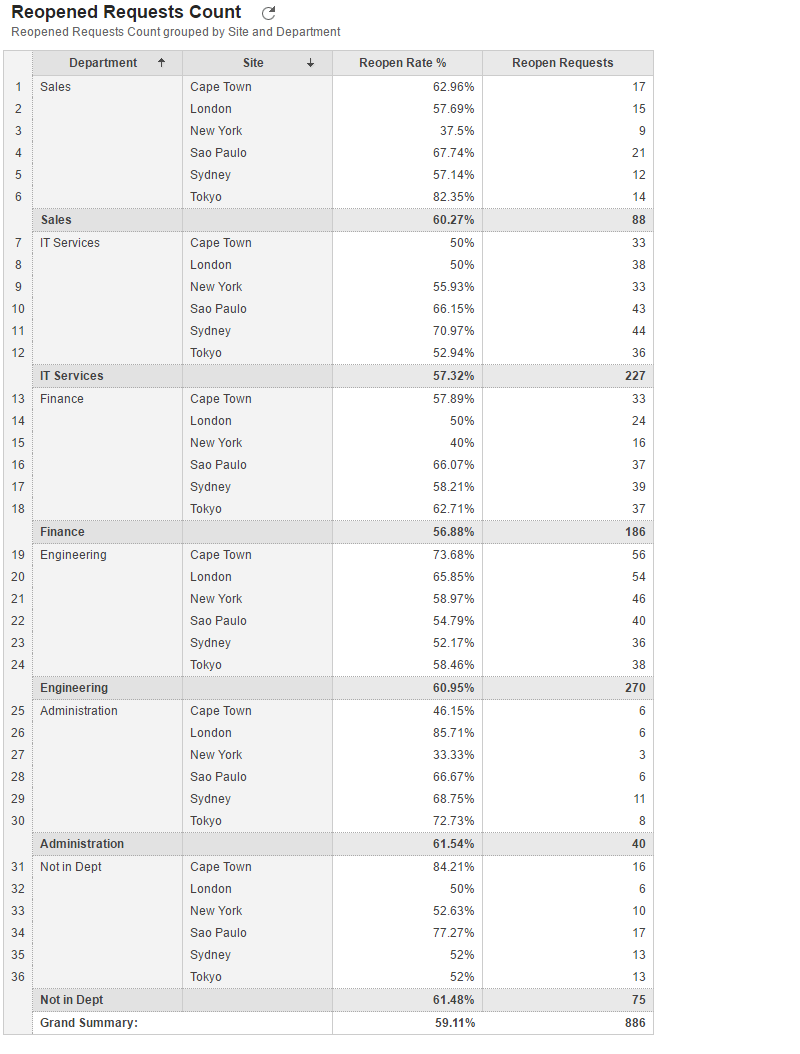
1. When you want to create multi-dimensional reports, opt for pivot charts.
Pivot charts are useful when you want to compare more than two metrics/fields/columns in your report.
Sample shows a pivot chart depicting the site and department wise grouping of reopened requests.
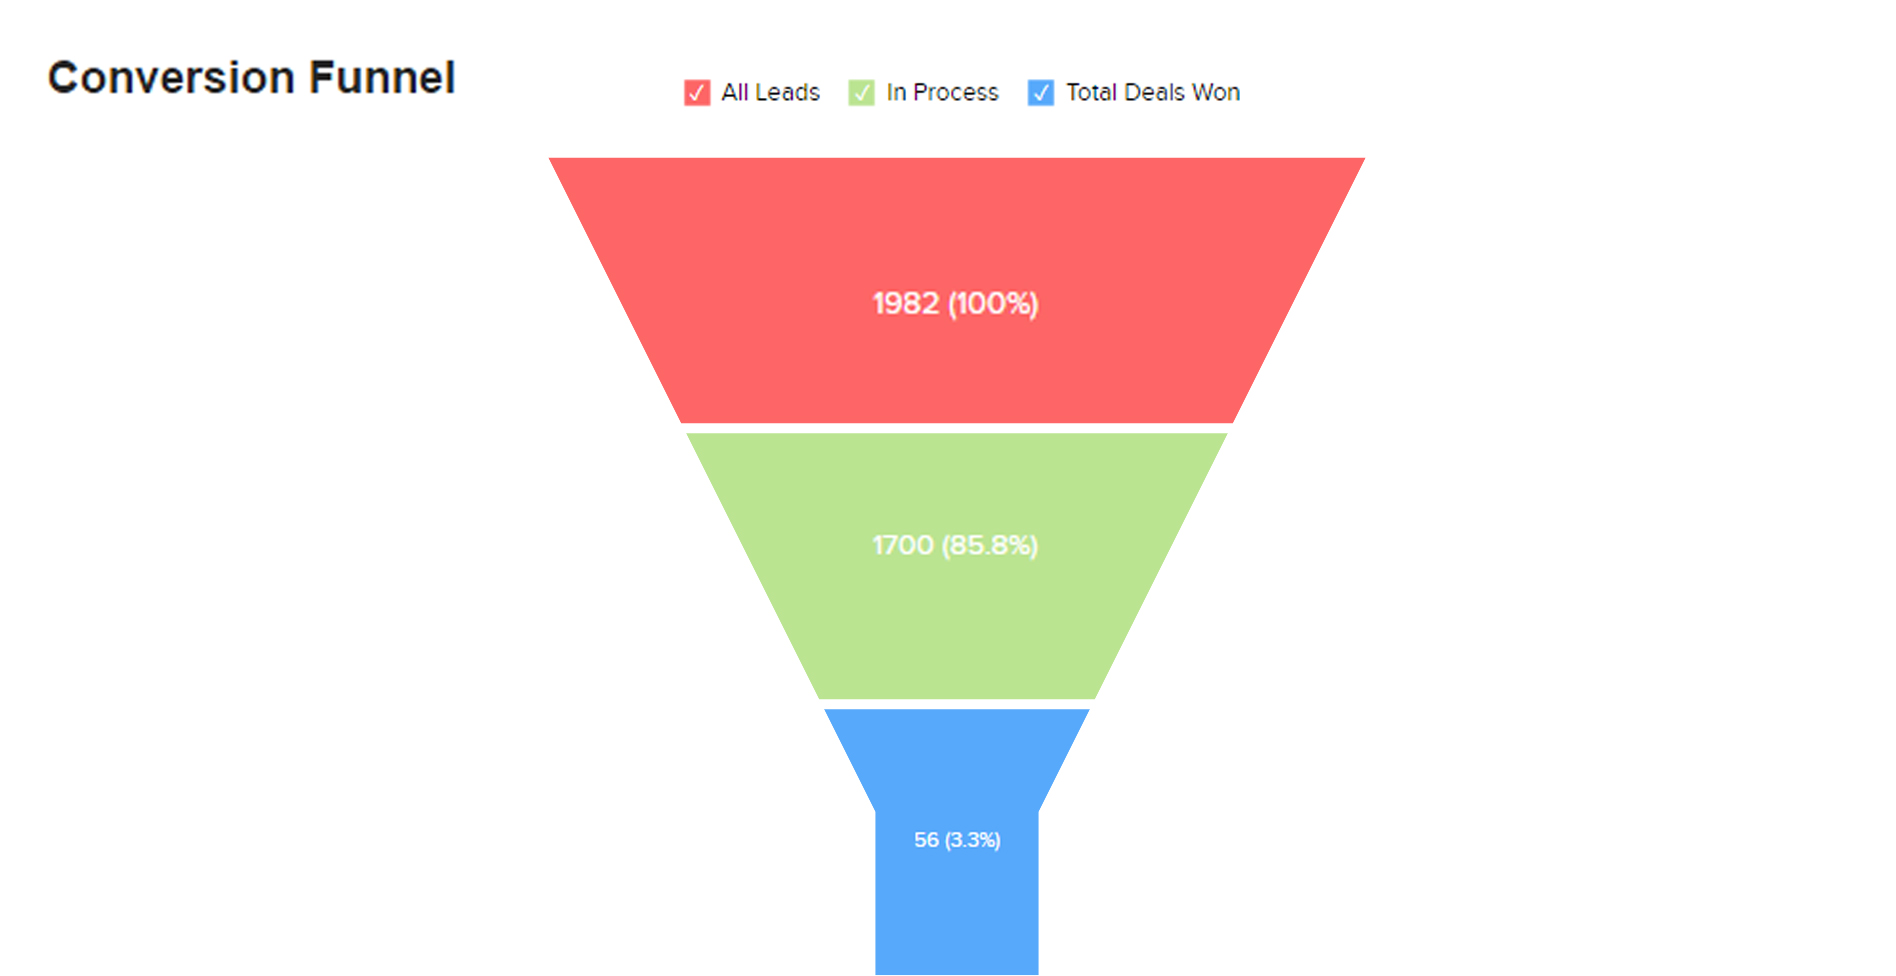
2. However, funnel charts are suitable for reports that show different stages or progress.
Sa Sample shows a funnel chart depicting the different stages involved in winning a deal.